


Predictive analytics is transforming demand forecasting by using data and machine learning to predict customer needs. Businesses that use these tools can reduce forecasting errors by 20%-50% and cut stockouts by up to 65%, saving billions annually. Unlike older methods that rely on static historical data, predictive analytics combines real-time inputs like weather, social trends, and economic indicators for dynamic, accurate forecasts.
Key benefits include:
- Improved inventory management: Up to 30% less excess stock.
- Reduced stockouts: Up to 80% fewer out-of-stock situations.
- Time savings: Automates manual processes, saving hours weekly.
- Higher accuracy: Forecast accuracy jumps to 85%-95%.
Examples include Walmart cutting stockouts by 25%-30% and Healf achieving a 75x ROI with AI tools. By integrating predictive models into systems like ERP or CRM, businesses can align inventory, production, and marketing for better results. The shift to predictive analytics is helping companies meet customer demand efficiently while reducing costs.
Demand forecasting: how predictive analytics helps plan for the future
sbb-itb-c00c5b1
Core Components of Predictive Analytics for Demand Forecasting
Predictive analytics for demand forecasting hinges on three essential components. Together, these elements transform raw data into actionable insights, enabling businesses to anticipate demand with greater precision.
Data Collection and Integration
The process begins with gathering the right mix of data from various sources. Internal data – like historical sales, inventory levels, and promotional activity – provides a solid foundation. Customer insights, including browsing behavior, social media interactions, and sentiment analysis, offer a deeper understanding of shopper preferences. External factors, such as GDP trends, weather conditions, public holidays, and local events (e.g., concerts or festivals), add critical context. Supply chain data, including vendor lead times and logistics updates, ensures forecasts align with operational realities.
Modern systems automate this process by pulling data directly from ERP, CRM, and similar platforms using APIs. Before analysis, the data undergoes cleaning, standardization, and transformation. This includes tasks like deduplicating SKUs, filling in missing values, and creating time-lag features to enhance the dataset’s usability for forecasting.
Statistical Models and Machine Learning Algorithms
Once the data is prepared, statistical models like ARIMA and linear regression establish a baseline by identifying trends, patterns, and seasonality in historical data. However, machine learning algorithms, such as XGBoost, LightGBM, and neural networks, take accuracy to the next level. These advanced tools can detect complex, non-linear relationships that traditional methods often overlook.
For example, between 2024 and 2025, the Eastern European supermarket chain NOVUS adopted a LightGBM model. Within six months, they achieved a 7% improvement in forecast accuracy compared to their previous methods [6]. This success stemmed from the model’s ability to analyze intricate relationships across thousands of products and external variables. Gradient boosting algorithms, in particular, excel by iteratively correcting errors from previous models, refining predictions with each step.
Real-Time Data Processing
In today’s fast-moving markets, relying on past-quarter data is no longer enough. Real-time data processing shifts forecasting from a reactive approach to a proactive system. This allows businesses to detect early signals – like sudden TikTok trends or unexpected weather changes – within days rather than months. To make this possible, data must be processed with minimal latency, often under an hour, so predictions can immediately inform operations.
Take Walmart, for instance. Between June 2018 and July 2020, they developed a scalable machine learning platform that integrated real-time variables like payroll calendars and weather data. When backtested over 52 weeks, the system improved forecast accuracy by 300 basis points in the U.S. and 500 basis points internationally [7]. This platform enabled "demand sensing", where companies dynamically adjust inventory, production, and pricing based on current signals. As a result, businesses using AI-driven demand forecasting have reported a 65% improvement in on-shelf availability [7].
These three components – data integration, advanced modeling, and real-time processing – work together to transform forecasting from a backward-looking exercise into a forward-thinking strategy.
How to Implement Predictive Demand Forecasting
You don’t need to dive headfirst into predictive demand forecasting. A phased approach works best, starting with simple methods and gradually advancing as your team becomes more comfortable with the process.
Creating a Baseline Forecast
The first step is to establish a basic benchmark – or "naïve" model – that acts as a reference point for evaluating improvements. For instance, you might assume next month’s sales will match last month’s or that this January will perform similarly to the previous one. The idea isn’t to get it perfect right away but to create a standard for comparison. If your advanced forecasting model can’t outperform this simple method, it’s worth reconsidering the added complexity [8].
Start by collecting historical sales data, promotional schedules, and external factors like holidays or weather. Clean the data by standardizing entries, removing duplicates, and filling in gaps. For seasonal products, a seasonal naïve method works well, while recent sales data might be better for items with erratic demand. Splitting your historical data into 80% for training and 20% for testing can help validate your model’s accuracy. Don’t forget to include a 14-day post-promotion period when forecasting for discounted items to account for customers stocking up during sales.
"The quest for the ‘perfect’ forecast isn’t about finding one magic algorithm – it’s about building a toolbox." – DemandPlan [8]
Building and Testing Predictive Models
Once you’ve established a baseline, the next step is to refine your predictions through more advanced models. This begins with feature engineering – creating new variables from existing data. For example, you might add predictors like day of the week, holiday indicators, lagged sales data, or weather forecasts. These additional factors can improve model accuracy by as much as 10% [9].
The choice of modeling technique depends on the complexity of your data. Linear regression works well for straightforward patterns, while more advanced methods like Random Forest or Gradient Boosting (XGBoost, LightGBM) handle non-linear relationships better. Many businesses use a "tournament" approach, testing multiple models – such as Moving Average, Holt-Winters, and machine learning algorithms – and selecting the one with the lowest error [8].
Real-world examples show how this works. In October 2022, Comcash, a US-based ERP provider, implemented an adaptive forecasting model with MobiDev. Using tools like Pandas and ABC-XYZ analysis, they generated real-time forecasts for over 3,000 retail locations. Similarly, SmartTab has been using Gradient Boosting combined with KNN models since 2014 to provide daily revenue forecasts for a network of over 1,000 nightclubs and bars [9].
Validation is key. Test your models thoroughly by checking assumptions like linearity and variance consistency. Use prediction intervals (e.g., 80% or 95% confidence ranges) to account for uncertainties instead of relying on single-point forecasts. Metrics like Mean Absolute Percentage Error (MAPE) are crucial; retail pilots often aim for 90% accuracy or better, with some achieving up to 96% for data-rich products [9]. If your advanced model doesn’t significantly outperform the simple baseline, stick with the simpler approach. On average, AI-driven demand forecasting can reduce errors by 20% to 50% and cut excess inventory by 10% to 25% within the first 12 weeks of use [9]. Keep in mind that regular retraining is essential to adapt to changing market conditions.
Once validated, it’s time to integrate these forecasts into your everyday operations.
Integrating Predictive Tools into Business Operations
Even the most accurate forecast will fall flat if it isn’t part of your daily workflow. Integration involves connecting your forecasting tools to live systems like Shopify, Amazon, QuickBooks, ERP, or WMS platforms to ensure predictions stay current as demand changes. Many modern platforms now offer over 70 direct integrations to bring together ecommerce and B2B data.
Start by auditing your infrastructure to ensure consistency in product metadata, inventory records, and order histories. AI tools rely on clean, accurate data, so any inconsistencies can lead to errors. For instance, Healf, a UK-based health and wellness retailer, implemented Prediko’s AI demand planning tool in 2025 to address forecasting inaccuracies. Within two months, they reduced stockouts from 4% to 1%, achieved a 75× return on investment, and saved 10 hours per week in manual inventory tasks [3].
Cross-functional collaboration is essential. Include teams from purchasing, marketing, and finance to align on how forecasts impact everything from order timing to campaign planning and cash flow. Assign an "AI champion" to oversee training, troubleshoot issues, and ensure smooth adoption. Automated alerts can also streamline operations by suggesting reorder quantities based on lead times and safety stock, making forecasts actionable.
The best systems strike a balance between AI and human expertise. Tools with explainable AI features can clarify the reasoning behind recommendations, allowing managers to review and approve decisions rather than blindly following opaque outputs. For example, Siemens partnered with Outreach to overhaul its global forecasting process across 4,000 sellers in 190 countries. By improving pipeline data quality and unifying processes, they increased forecast submission rates above 70% and gained deeper insights into their revenue structure [10].
"With Outreach we get increased transparency. Now we are getting much easier, deeper insights into the structure in a way we’ve never had before." – Thorsten Reichenberger, Head of Revenue Operations, Siemens [10]
Finally, create feedback loops by regularly comparing forecasts to actual outcomes. Investigate any discrepancies – whether due to supplier delays, unexpected demand spikes, or promotional missteps – and adjust your assumptions as needed. Companies that update their KPIs based on AI insights are three times more likely to see meaningful financial gains.
Benefits and Applications of Predictive Analytics in Demand Forecasting
Traditional vs Predictive Analytics Demand Forecasting Comparison
Key Benefits for Businesses
Using real-time data and AI-powered models has transformed forecasting into a forward-thinking, cost-saving strategy. One of the biggest wins for businesses is inventory optimization. Companies typically see a 20% to 30% reduction in excess stock while maintaining fill rates above 95% [24, 27]. This balance directly impacts profitability, often boosting margins by 3 to 5 percentage points through lower carrying costs, fewer emergency shipments, and reduced markdowns [11].
Automation also plays a huge role, cutting manual workload by 50% and preventing costly errors. By integrating external signals like weather patterns, social trends, and competitor data, forecasts can adjust instantly [24, 25, 27]. This is particularly important when you consider that retailers lose a staggering $1.2 trillion annually due to out-of-stock situations. Predictive tools help reduce stockouts by 60% to 80%, saving businesses from these losses [11].
For industries dealing with perishable goods, minimizing waste is critical. Predictive models allow pharmaceutical companies and food retailers to align supply with demand more precisely, cutting spoilage. The financial benefits don’t stop there – warehousing costs can drop by 5% to 10%, and administrative costs often fall by 25% to 40% [12]. Even customer retention hinges on accurate forecasting, as 43% of customers switch to competitors after experiencing just one stockout [11]. Predictive analytics also helps businesses make smarter marketing decisions, eliminating the 15% to 25% of ad spend wasted on promoting out-of-stock items [11].
Industry Use Cases
Examples from various industries highlight the immense benefits of predictive analytics. Retail and e-commerce lead the way, with Walmart using advanced neural networks to forecast demand across different timeframes. By February 2026, Walmart had reduced stockouts by 25% to 30%, leveraging real-time point-of-sale data, weather forecasts, and regional buying trends [11]. Amazon, on the other hand, credits about 35% of its sales to its predictive recommendation engine, which matches users with products based on browsing history and search behavior [1].
In manufacturing, companies like Siemens, GE, and Whirlpool use predictive models to streamline production. Siemens reported a 15% cut in inventory costs and a 20% reduction in production lead times thanks to AI-driven forecasting [13]. Levi’s, for instance, uses machine learning to adapt to rapid fashion trends, achieving a 15% drop in stockouts and a 10% boost in inventory turnover [12]. Similarly, Zara analyzes real-time sales data to adjust production, scaling back on slower-moving designs to avoid excess stock [1].
The healthcare and pharmaceutical sectors have also embraced predictive analytics, with adoption rates jumping from 41% in 2024 to 65% in 2025 [12]. Pharmaceutical companies use these tools to forecast drug demand based on seasonal illnesses, while hospitals predict bed occupancy and staffing needs. In the automotive industry, which held an 18% share of the AI supply chain market in 2024, predictive analytics helps manage parts forecasting and complex global supplier networks [12]. Meanwhile, food and beverage companies use these models to account for variables like weather, holidays, and local events, reducing waste from perishable goods. Logistics providers also benefit, using predictive tools to forecast shipping volumes and secure carrier capacity ahead of price hikes [27, 29, 5].
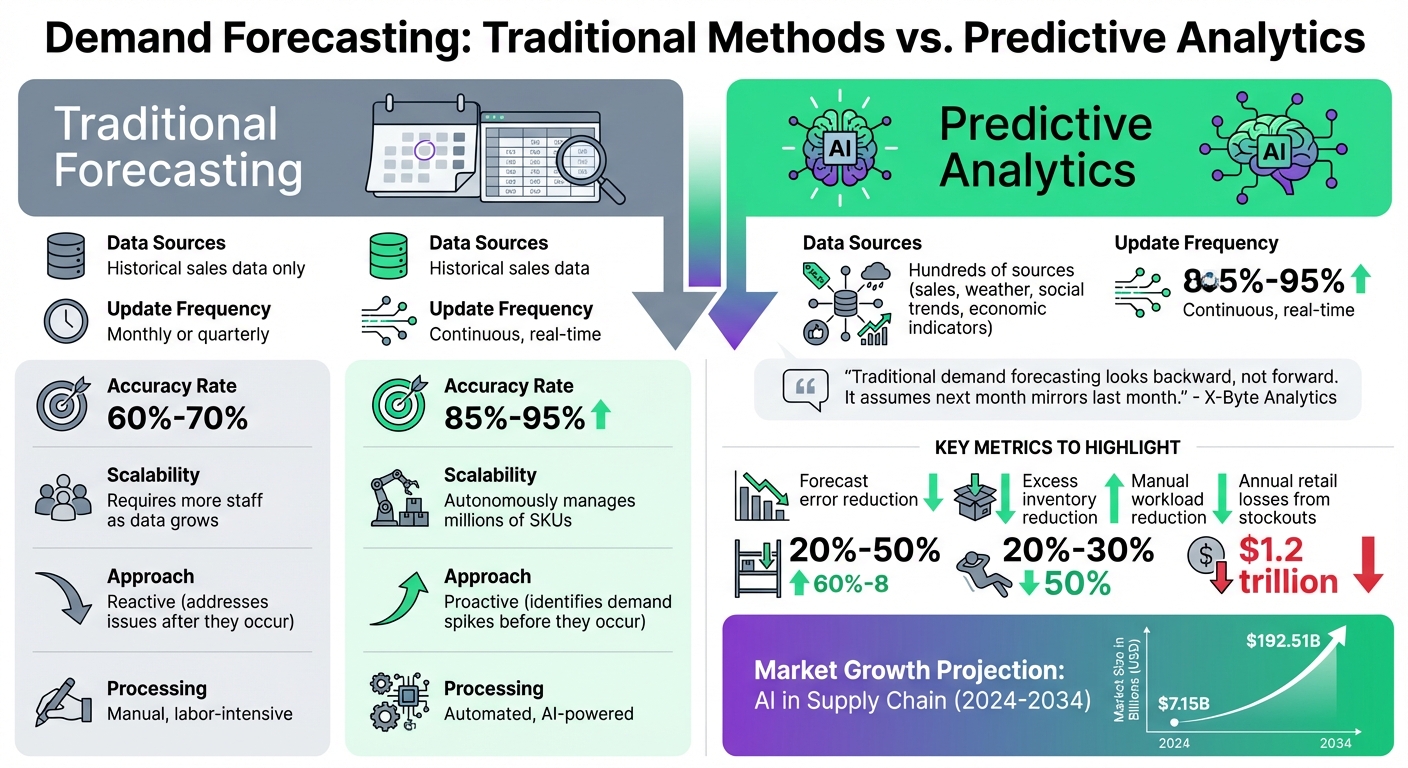
Comparison: Old Methods vs. Predictive Analytics
Compared to traditional forecasting methods, predictive analytics offers clear advantages in both scalability and accuracy. Older systems relied solely on historical sales data, updating monthly or quarterly, with accuracy rates hovering between 60% and 70% [24, 27]. Predictive analytics, on the other hand, pulls from hundreds of data sources and updates continuously, achieving accuracy levels of 85% to 95% [24, 27].
Scalability is another game-changer. Traditional methods require more staff as data volumes grow, while predictive systems can autonomously manage millions of SKUs across multiple locations [5, 27]. Older methods are reactive, addressing issues only after they arise. Predictive analytics flips the script, identifying potential demand spikes before they occur [3, 1]. This shift to a forward-looking approach has fueled the projected growth of the global AI in supply chain market, from $7.15 billion in 2024 to $192.51 billion by 2034 [12].
"Traditional demand forecasting looks backward, not forward. It assumes next month mirrors last month." – X-Byte Analytics [11]
Conclusion
Predictive analytics is changing the game for demand forecasting by moving away from reactive guesswork toward proactive, data-driven strategies. By combining external factors – like weather conditions, social media trends, and economic signals – with historical sales data, businesses can predict market changes before they happen. Studies show this approach significantly boosts accuracy, efficiency, and return on investment. In fact, the global AI demand forecasting market is expected to hit $826.70 billion by 2030 [2][4][14].
"AI-driven forecasting empowers organizations to take a proactive approach, fine-tuning their strategies in real time to improve efficiency, maximize profitability, and meet future customer demand with greater precision." – Vladimir Terekhov, CEO, Attract Group [5]
Getting started doesn’t require a huge initial investment. A small-scale pilot project focused on high-priority product lines or specific regions can deliver quick results. To succeed, businesses should prioritize clean, well-organized data and assemble cross-functional teams with members from sales, marketing, and supply chain. This ensures that forecasts lead directly to automated actions, like restocking inventory or adjusting prices [1][3][14].
Predictive analytics offers more than just better forecasts – it’s a step toward building a scalable, efficient operation that can handle thousands of SKUs, multiple sales channels, and global supply chains. Companies adopting this approach will be better equipped to meet customer demands with precision in today’s unpredictable markets.
Want to take your forecasting to the next level? Explore AI-powered solutions at My Rich Brand.
FAQs
What data do I need to start predictive demand forecasting?
To start with predictive demand forecasting, the first step is gathering historical and current data that reveals demand patterns. This includes essential information like past sales figures, inventory levels, promotional activities, and external influences such as market trends, social media buzz, weather conditions, and economic shifts. By integrating this data with real-time processing and applying a variety of forecasting techniques, you can achieve more precise results. It’s crucial to pay attention to both internal data (like sales transactions) and external signals, as these form the foundation for effective machine learning models and time series analysis.
How do I know if an AI forecast is actually better than my current method?
To see if an AI forecast does better than your existing approach, compare its accuracy and reliability using both historical data and real-time outcomes. Pay attention to measurable benefits, like lower forecast errors or reduced variance. Running a pilot test or doing a side-by-side comparison can provide clear insights. AI models often shine in handling external factors and shifting market conditions, delivering more responsive results than traditional methods.
How can I integrate predictive forecasting into my ERP/CRM without disrupting operations?
Start by implementing a small-scale Proof of Concept (PoC) to explore predictive forecasting within your ERP or CRM system. Choose AI-powered tools that integrate smoothly with your existing setup, offering real-time insights without causing significant interruptions. Ensure your data is clean and precise, as accurate data is the backbone of reliable forecasts. Use models that adapt and refine themselves over time for improved performance.
Additionally, include scenario planning in your approach. This helps you anticipate and prepare for potential disruptions, such as supply chain delays or unexpected demand surges. By doing so, you’ll not only handle these challenges more effectively but also improve the accuracy of your forecasts over time.


